


Emulation of Malicious Shellcode With Speakeasy
In order to enable emulation of malware samples at scale, we have developed the Speakeasy emulation framework. Speakeasy aims to make it as easy as possible for users who are not malware analysts to acquire triage reports in an automated way, as well as enabling reverse engineers to write custom plugins to triage difficult malware families.
Originally created to emulate Windows kernel mode malware, Speakeasy now also supports user mode samples. The project’s main goal is high resolution emulation of the Windows operating system for dynamic malware analysis for the x86 and amd64 platforms. Similar emulation frameworks exist to emulate user mode binaries. Speakeasy attempts to differentiate from other emulation frameworks the following ways:
- Architected specifically around emulation of Windows malware
- Supports emulation of kernel mode binaries to analyze difficult to triage rootkits
- Emulation and API support driven by current malware trends to provide the community with a means to extract indicators of compromise with no extra tooling
- Completely configurable emulation environment requiring no additional code
The project currently supports kernel mode drivers, user mode Windows DLLs and executables, as well as shellcode. Malware samples can be automatically emulated, with reports generated for later post processing. The ongoing project goal will be continuing to add support for new or popular malware families.
In this blog post, we will show an example of Speakeasy’s effectiveness at automatically extracting network indicators from a Cobalt Strike Beacon sample acquired from an online malware aggregate.
Background
Dynamic analysis of Windows malware has always been a crucial step during the malware analysis process. Understanding how malware interacts with the Windows API and extracting valuable host-based and network-based indicators of compromise (IOCs) are critical to assessing the impact malware has on an affected network. Typically, dynamic analysis is performed in an automated or targeted fashion. Malware can be queued to execute within a sandbox to monitor its functionality, or manually debugged to reveal code paths not executed during sandbox runs.
Code emulation has been used historically for testing, validation and even malware analysis. Being able to emulate malicious code lends many benefits from both manual and automated analysis. Emulation of CPU instructions allows for total instrumentation of binary code where control flow can be influenced for maximum code coverage. While emulating, all functionality can be monitored and logged in order to quickly extract indicators of compromise or other useful intelligence.
Emulation provides several advantages over execution within a hypervisor sandbox. A key advantage is noise reduction. While emulating, the only activity that can be recorded is either written by the malware author, or statically compiled within the binary. API hooking within a hypervisor (especially from a kernel mode perspective) can be difficult to attribute to the malware itself. For example, sandbox solutions will often hook heap allocator API calls without knowing if the malware author intended to allocate memory, or if a lower-level API was responsible for the memory allocation.
However, emulation has disadvantages as well. Since we are removing the operating system from the analysis phase, we, as the emulator, are now responsible for providing the expected inputs and outputs from API calls and memory access that occur during emulation. This requires substantial effort in order to successfully emulate malware samples that are expected to the run on a legitimate Windows system.
Shellcode as an Attack Platform
In general, shellcode is an excellent choice for attackers to remain stealthy on an infected system. Shellcode runs within executable memory and does not need to be backed by any file on disk. This allows attacker code to hide easily within memory where most forms of traditional forensic analysis will fail to identify it. Either the original binary file that loads the shellcode must first be identified, or the shellcode itself must be dumped from memory. To avoid detection, shellcode can be hidden within a benign appearing loader, and then be injected into another user mode process.
In the first part of this blog series, we will show the effectiveness of emulation with one of the more common samples of shellcode malware encountered during incident response investigations. Cobalt Strike is a commercial penetration testing framework that typically utilizes stagers to execute additional code. An example of a stager is one that downloads additional code via a HTTP request and executes the HTTP response data. The data in this case is shellcode that commonly begins with a decode loop, followed by a valid PE that contains code to reflectively load itself. In the case of Cobalt Strike, this means it can be executed from the start of the executable headers and will load itself into memory. Within the Cobalt Strike framework, the payload in this case is typically an implant known as Beacon. Beacon is designed to be a memory resident backdoor used to maintain command and control (C2) over an infected Windows system. It is built using the Cobalt Strike framework without any code modifications and can be easily built to have its core functionality and its command and control information modified.
All of this allows attackers to rapidly build and deploy new variants of Beacon implants on compromised networks. Therefore, a tool to rapidly extract the variable components of Beacon are necessary and, ideally, will not require the valuable time of malware analysts.
Speakeasy Design
Speakeasy currently employs the QEMU-based emulator engine Unicorn to emulate CPU instructions for the x86 and amd64 architectures. Speakeasy is designed to support arbitrary emulation engines in the future via an abstraction layer, but it currently relies on Unicorn.
Full OS sandboxing will likely always be required to analyze all samples as generically emulating all of Windows is somewhat unfeasible. Sandboxing can be difficult to scale on demand and can be time consuming to run samples. However, by making sure we emulate specific malware families, such as Beacon in this example, we can quickly reduce the need to reverse engineer variants. Being able to generate high level triage reports in an automated fashion is often all the analysis that is needed on a malware variant. This allows malware analysts more time to focus on samples that may require deeper analysis.
Shellcode or Windows PEs are loaded into the emulated address space. Windows data structures required to facilitate basic emulation of Windows kernel mode and user mode are created before attempting to emulate the malware. Processes, drivers, devices and user mode libraries are “faked” in order to present the malware with a realistic looking execution environment. Malware will be able to interact with an emulated file system, network and registry. All these emulated subsystems can be configured with a configuration file supplied to each emulation run.
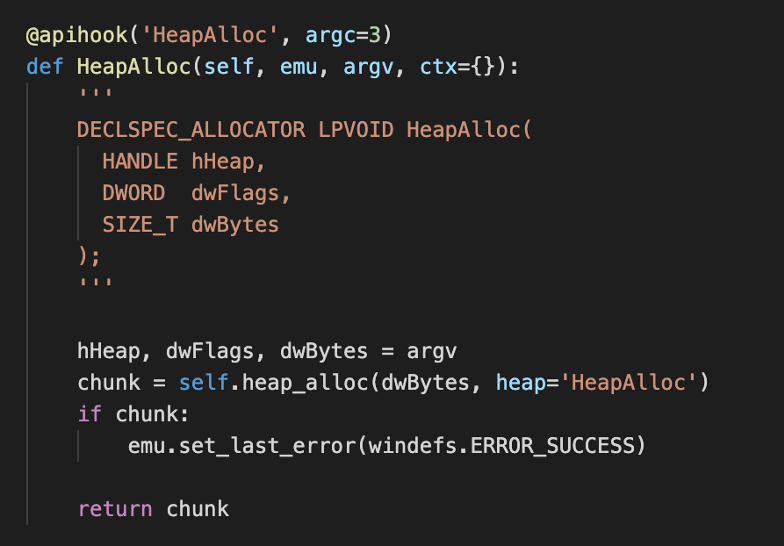
Windows APIs are handled by Python API handlers. These handlers will try to emulate expected outputs from these APIs so that malware samples will continue their expected execution path. When defining an API handler, all that is needed is the name of the API, the number of arguments the API expects, and an optional calling convention specification. If no calling convention is supplied, stdcall is assumed. Currently, if an API call is attempted that is not supported, Speakeasy will log the unsupported API and move on to the next entry point. An example handler for the Windows HeapAlloc function exported by kernel32.dll is shown in Figure 1.
All entry points are emulated by default. For example, for DLLs, all exports are emulated, and for drivers, the IRP major functions are each emulated. In addition, dynamic entry points that are discovered during runtime are followed. Some examples of dynamic entry points include threads that are created or callbacks that are registered. Attributing activity to specific entry points can be crucial to seeing the whole picture when trying to identify the impact of a malware infection.
Reporting
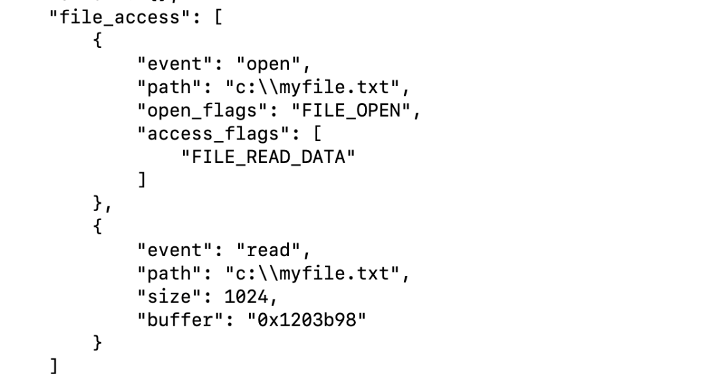
Currently, all events captured by the emulator are logged and represented by a JSON report for easy post processing. This report contains events of interest that are logged during emulation. Like most emulators, all Windows API calls are logged along with arguments. All entry points are emulated and tagged with their corresponding API listings. In addition to API tracing, other specific events are called out including file, registry and network access. All decoded or “memory resident” strings are dumped and displayed in the report to revealed useful information not found within static string analysis. Figure 2 shows an example of a file read event logged in a Speakeasy JSON report.
Speed
Because the framework is written in Python, speed is an obvious concern. Unicorn and QEMU are written in C, which provides very fast emulation speeds; however, the API and event handlers we write are in Python. Transitioning between native code and Python is extremely expensive and should be done as little as possible. Therefore, the goal is to only execute Python code when it is absolutely necessary. By default, the only events we handle in Python are memory access exceptions or Windows API calls. In order to catch Windows API calls and emulate them in Python, import tables are doped with invalid memory addresses so that we only switch into Python when import tables are accessed. Similar techniques are used for when shellcode accesses the export tables of DLLs loaded within the emulated address space of the malware. By executing as little Python code as possible, we can maintain reasonable speeds while still allowing users to rapidly develop capabilities for the framework.
Memory Management
Speakeasy implements a lightweight memory manager on top of the emulator engine’s memory management. Each chunk of memory allocated by malware is tracked and tagged so that meaningful memory dumps can be acquired. Being able to attribute activity to specific chunks of memory can prove to be extremely useful for analysts. Logging memory reads and writes to sensitive data structures can reveal the true intent of malware not revealed by API call logging, which is particularly useful for samples such as rootkits.
Speakeasy offers an optional “memory tracing” feature that will log all memory accesses that samples exhibit. This will log all reads, writes and executes to memory. Since the emulator tags all allocated memory chunks, it is possible to glean much more context from this data. If malware hooks a critical data structure or pivots execution to dynamically mapped memory this will be revealed and can be useful for debugging or attribution. This feature comes at a great speed cost, however, and is not enabled by default.
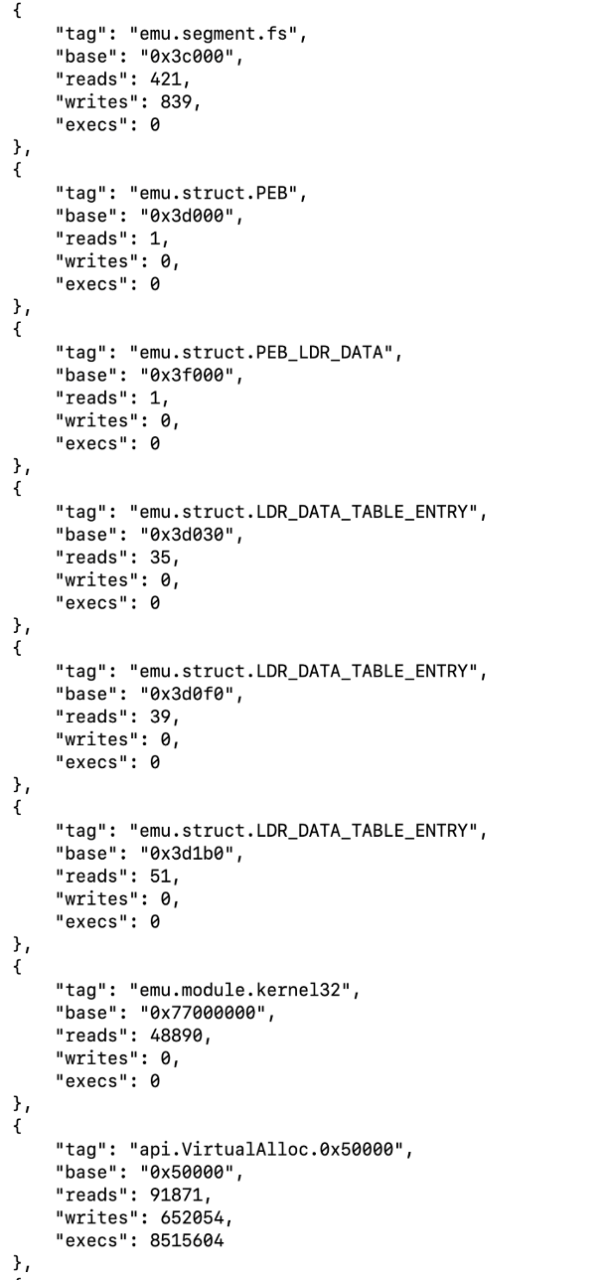
The emulated environment presented to malware includes common data structures that shellcode uses to locate and execute exported Windows system functions. It is necessary to resolve exported functions in order to invoke the Win32 API and therefore have meaningful impact on a targeted system. In most cases, Beacon included, these functions are located by walking the process environment block (commonly called the PEB). From the PEB, shellcode can access a list of all loaded modules within a process’s virtual address space.
Figure 3 shows a memory report generated from emulating a Beacon shellcode sample. Here we can trace the malware walking the PEB in order to find the address of kernel32.dll. The malware then manually resolves and calls the function pointer for the “VirtualAlloc” API, and proceeds to decode and copy itself into the new buffer to pivot execution.
Configuration
Speakeasy is highly configurable and allows users to create their own “execution profiles”. Different levels of analysis can be specified in order to optimize individual use cases. The end goal is allowing users easy switching of configuration options with no code changes. Configuration profiles are currently structured as JSON files. If no profile is provided by the user, a default configuration is provided by the framework. The individual fields are documented within the Speakeasy project.
Figure 4 shows a snippet of the network emulator configuration subsection. Here, users can specify what IP addresses get returned when a DNS lookup occurs, or in the case of some Beacon samples, what binary data gets returned during a TXT record query. HTTP responses have custom responses configured as well.
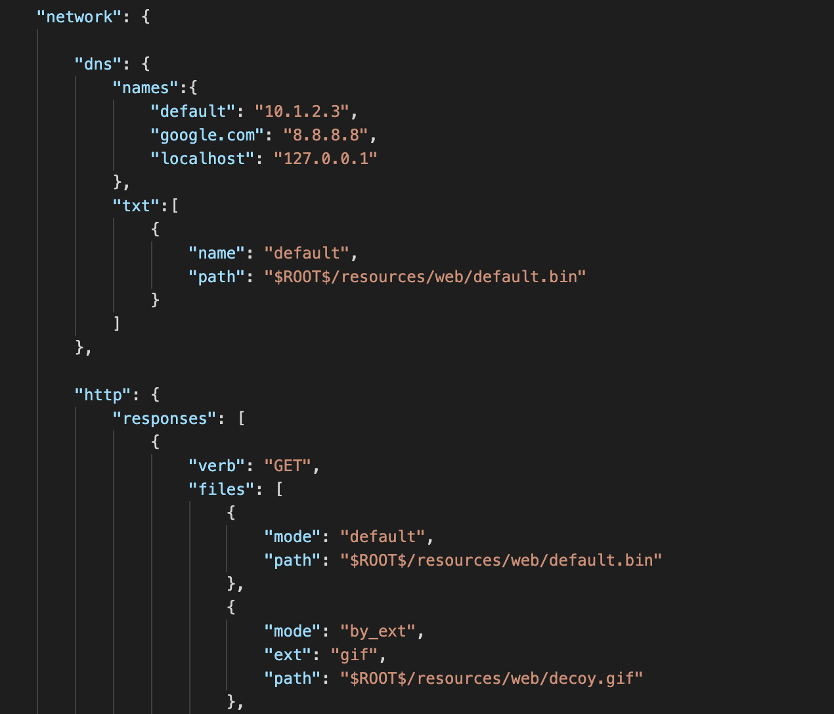
Many HTTP stagers will retrieve a web resource using a HTTP GET request. Often, such as with Cobalt Strike or Metasploit stagers, this buffer is then immediately executed so the next stage of execution can begin. This response can be easily configured with Speakeasy configurations. In the configuration in Figure 4, unless overridden, the framework will supply the data contained in the referenced default.bin file. This file currently contains debug interrupt instructions (int3), so if the malware attempts to execute the data it exits and will be logged in the report. Using this, we can easily label the malware as a downloader that downloads additional code. Configuration fields also exist for file system and registry emulation. Files and registry paths can similarly be configured to return data to samples that expect to be running on a live Windows system.
Limitations
As said, emulation comes with some challenges. Maintaining feature parity with the system being emulated is an ongoing battle; however, it provides unique opportunities for controlling the malware and greater introspection options.
In cases where emulation does not complete fully, emulation reports and memory dumps can still be generated in order to gather as much data as possible. For example, a backdoor may successfully install its persistence mechanism, but fail to connect to its C2 server. In this situation, the valuable host-based indicators are still logged and can provide value to an analyst.
Missing API handlers can quickly and easily be added to the emulator in order to handle these situations. For many API handlers, simply returning a success code will be sufficient to make the malware to continue execution. While full emulation of every piece of malware may not be feasible, targeting functionality of specific malware families can greatly reduce the need to reverse engineer variants of the same families.
Usage
Speakeasy is available right now on our GitHub. It can be installed with the included Python installer script or installed within a Docker container using the provided Dockerfile. It is platform agnostic and can be used to emulate Windows malware on Windows, Linux or MacOS. More information can be found on the project’s README.
Once installed, Speakeasy can be used as a standalone library or invoked directly using the provided run_speakeasy.py script. In this blog post we will demonstrate how to emulate a malware sample directly from the command line. For information on how to use Speakeasy as a library, see the project’s README.
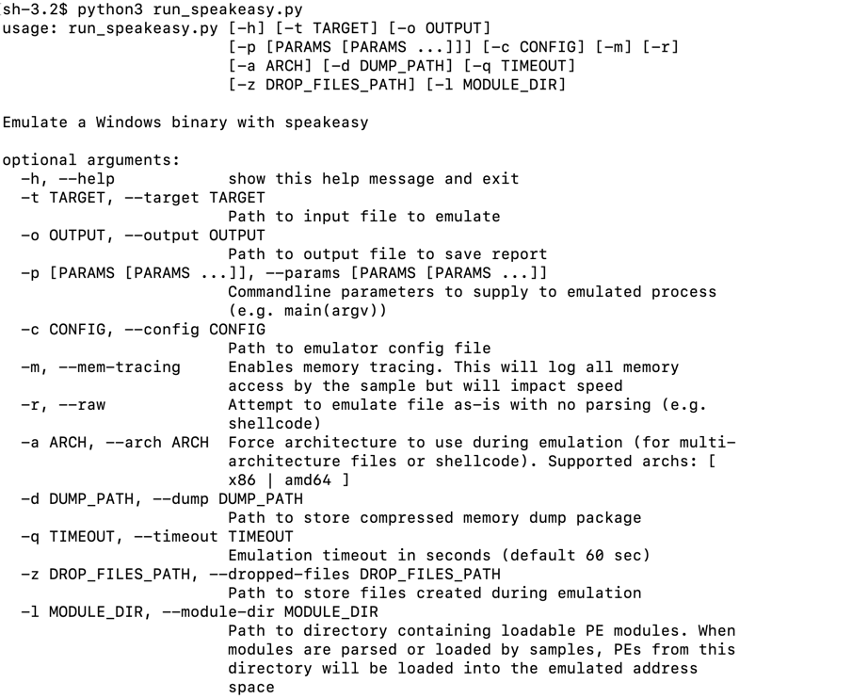
The included script is meant to emulate a single sample and generate a JSON report with the logged events. The command line arguments for run_speakeasy.py are shown in Figure 5.
Speakeasy also offers a rich development and hooking interface for writing custom plugins. This will be covered in more detail in a later blog post.
Emulation of a Beacon Implant
For this example, we will be emulating shellcode that decodes and executes a Beacon implant variant that has a SHA-256 hash of 7f6ce8a8c2093eaf6fea1b6f1ef68a957c1a06166d20023ee5b637b5f7838918. We begin by verifying the file format of the sample. This sample is expected to be launched either by a loader or used as part of an exploit payload.
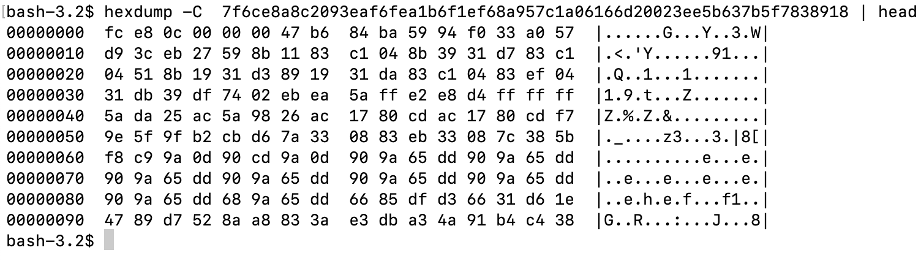
In Figure 6, we can clearly see that the file is not in the PE file format. An analyst who has seen many shellcode samples may notice the first two bytes: “0xfc 0xe8”. These bytes disassemble to the intel assembly instructions “cld” and “call”. The “cld” instruction is a common prelude to position independent shellcode as it will clear the direction flag allowing malware to easily parse string data from system DLL’s export tables. The following call instruction is often used by shellcode to get its current program counter by following it with a “pop” instruction. This allows the malware to discover where it is executing from in memory.
Since we are reasonably certain this sample is shellcode, we will invoke Speakeasy with the command line shown in Figure 7.

This will instruct Speakeasy to emulate the sample from offset zero as x86 shellcode. Note: even though we are emulating code and not actually executing it, these are still attacker generated binaries. It may still be wise to emulate malicious code within a virtual machine in the event a vulnerability is discovered in whatever native CPU emulation engine is used.
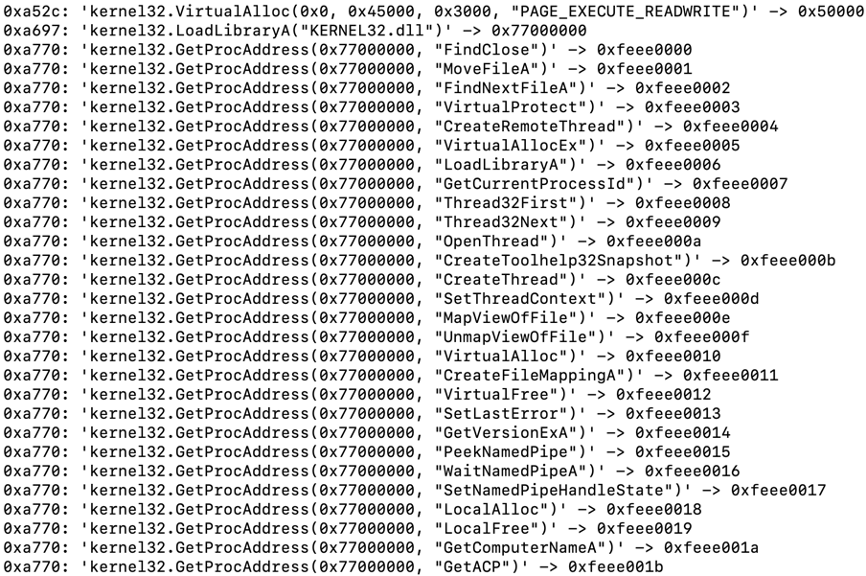
After emulation, a report will be generated named “report.json”. In addition, a full memory dump of the emulation environment will be compressed and written to “memory_dump.zip”. The malware will get loaded into emulated memory inside of a fake container process to simulate a real execution environment that shellcode would expect to be running in. Once emulation begins, emulated API calls will be logged to the screen along with their arguments and return values. Figure 8 shows the Beacon sample allocating a new memory buffer where it will copy itself. The malware then begins to manually resolve exports it needs to execute.
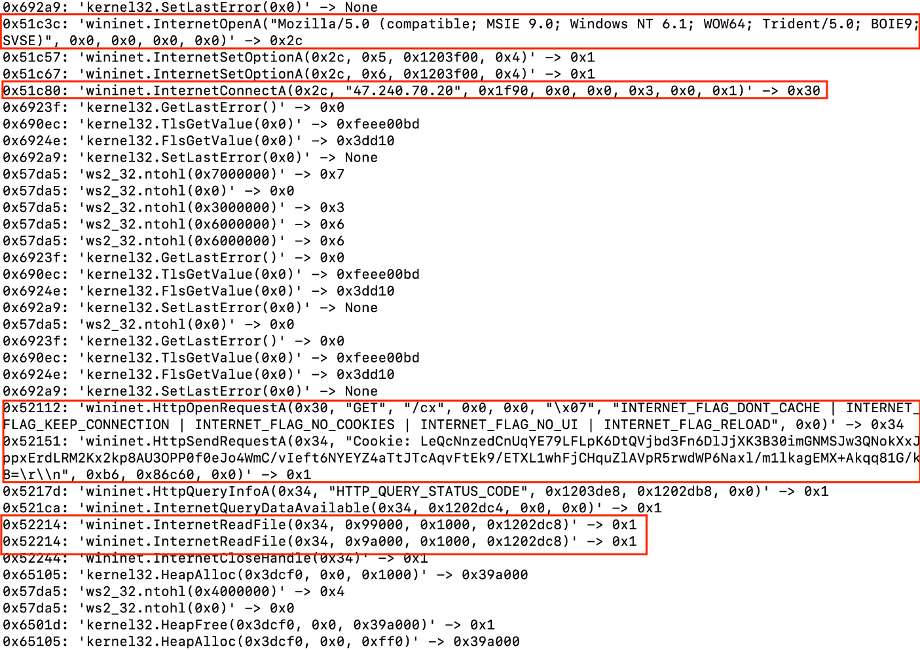
After additional decoding and setup, the malware attempts to connect to its C2 server. In Figure 9, we can see the malware using the Wininet library to connect and read data from the C2 server using HTTP.
The malware will loop endlessly until it receives the data it expects from its C2 server. Speakeasy will timeout after a predetermined amount of time and generate a JSON report.
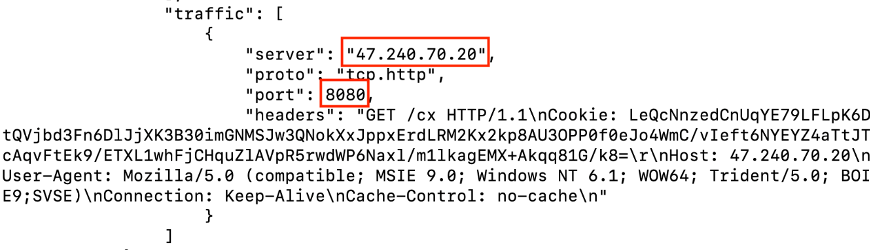
The network indicators are summarized in the “network_events” and “traffic” sections of the generated report. In Figure 10, we can see the IP address, port number and, in this case, HTTP headers associated with the connections made by the malware.
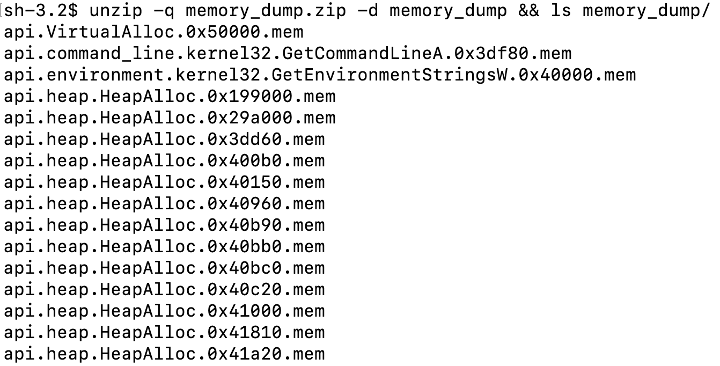
In this example, when we emulated the sample, we instructed Speakeasy to create a memory dump of the emulated address space. A ZIP archive will get created of each memory allocation along with context around it. This context includes base address, size and a tag that is assigned by the emulator in order to identify what the memory allocation corresponds to. Figure 11 shows a snippet of the memory dump files created during emulation. The file names contain the tag and base address associated with each memory allocation.
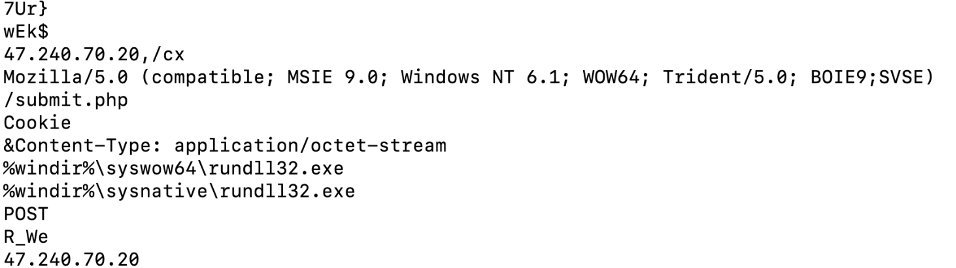
If we just run strings on these memory dumps, we can quickly locate interesting strings along with the Beacon configuration data, which is shown in Figure 12.
In a triage level of analysis, we may only care about the indicators of compromise for a malware variant of a known family. However, if full reverse engineering of the sample is required, we can also recover the decoded version of the Beacon malware in its DLL form. By simply doing a primitive grep for the “MZ” magic bytes, we find the only hits are the memory dumps related to the original sample’s allocation and the virtual allocated buffer that the malware copies itself to (Figure 13).
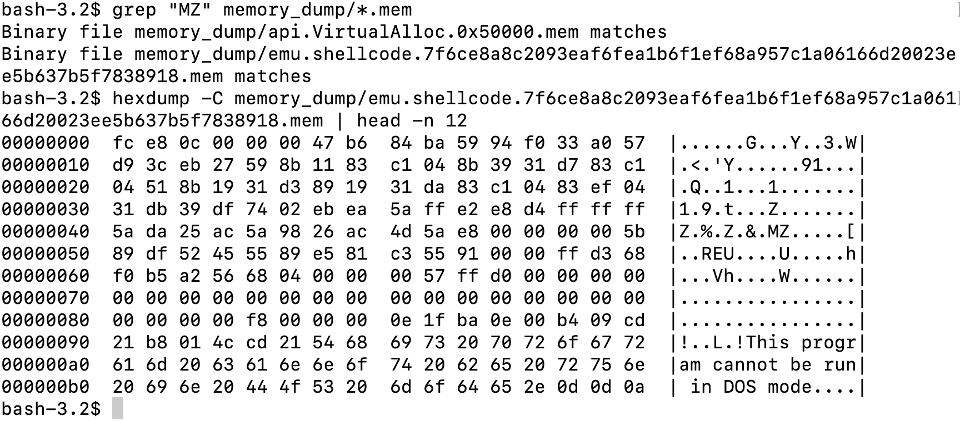
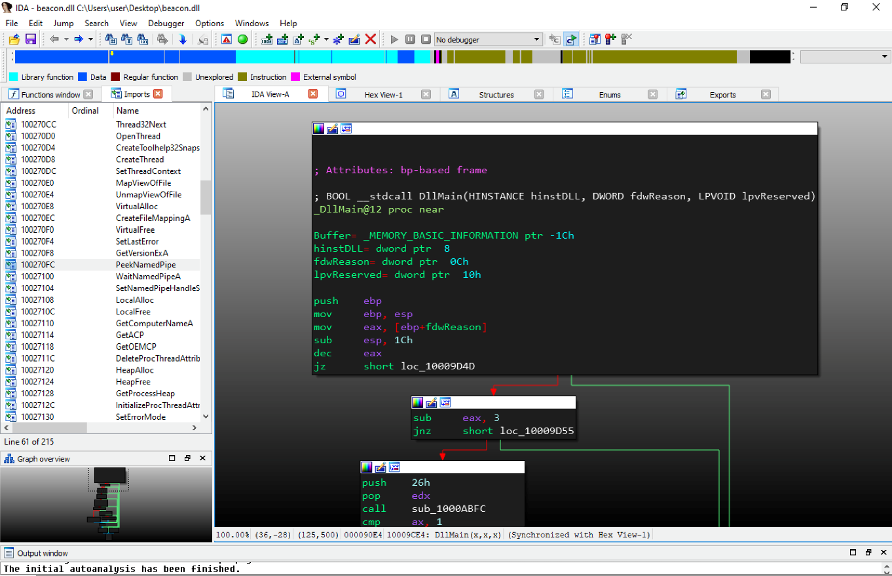
If we look at the bytes in the original shellcode buffer, we can see that it was decoded before it was copied and is sitting in memory ready to be dumped at offset 0x48. We can now successfully load the decoded Beacon DLL into IDA Pro for full analysis (Figure 14).
Conclusion
In this blog post we demonstrated how the Speakeasy emulation framework can be used to automatically triage a Beacon malware sample. We used it to discover valuable network indicators, extract its config information from memory, and acquire a decoded Beacon DLL for further analysis.
Head over to our GitHub to start using Speakeasy today, and stay tuned for the next blog post where we will demonstrate kernel malware analysis using emulation.
Prepare for 2024's cybersecurity landscape.
Get the Google Cloud Cybersecurity Forecast 2024 report to explore the latest trends on the horizon.