


Monitoring Windows Console Activity (Part 2)
This is the second of two blogs that discuss the implementation of the Windows console architecture from years past, with a primary focus on the current implementation present on modern versions of Windows. Read our first blog, "Monitoring Windows Console Activity Part 1," for more.
Capturing the Data
Before we examine how to capture console data, an understanding of how this differs from capturing process arguments may be useful. After all, can't we just examine the Process Environment Block (PEB) for each process and gather the command line arguments? This would show us the command arguments that an attacker used when executing tasks on a compromised machine. However, if an attacker is using any command line tools that are interactive at runtime, this data structure can't show us what commands the attacker issued to the tool.
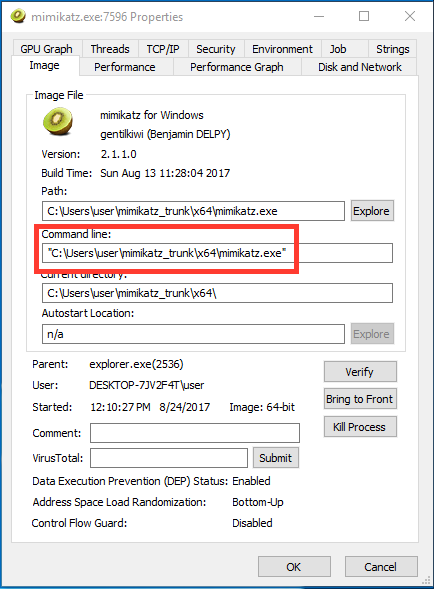
For example, Figure 1 shows the command line used to execute an instance of the popular credential dumping tool, mimikatz. An attacker could use any of the several features of this tool, including credential stealing or hash dumping. Additionally, knowing what user accounts the attacker compromised is difficult because we can't see the output of mimikatz at the time it was executed. Later we will look at the value of gathering this data from the console and how this level of context is useful.
Now that we understand how all this works, how can we intercept the data? Doing so on Windows 7 and earlier seems pretty difficult. It seems possible (albeit a little impractical) that we could capture the data by synchronizing with the ConsoleEvent object we mentioned earlier, and then read data out of the section object containing the data. Another way could be sending the necessary ALPC messages to access the command data, and in fact there is an exported API in kernel32.dll that does exactly that. GetConsoleCommandHistory will retrieve commands from the current console session. The downside here is that you have to be executing in the context of a client process to use this API. This would require process injection or some other illicit means. Neither of these methods are particularly elegant.
The console driver used in Windows 8 and later simplifies this quite a bit. Because the driver exposes a device object, we should be able to attach and filter on it. But then what? We need to understand how the feature is implemented in more detail and how the data is formatted.
Looking at the driver entry point, we see some pretty standard driver initialization. What is interesting, however, is the initialization of the Fast I/O Device Control dispatch function. This function will be called by the kernel before the standard IRP-based IRP_MJ_DEVICE_CONTROL dispatch function. The fast version can then choose to mark the operation as complete, or pass it back and have an IRP generated. Figure 2 shows the interesting entry points for ConDrv.
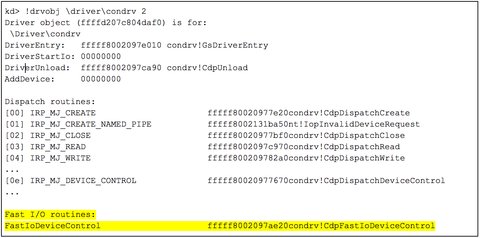
Figure 2: Entry points for the Windows Console Driver (ConDrv)
Some quick poking around in the user code reveals that just about all data we are interested in is transferred by NtDeviceIoControlFile to ConDrv. Data is also transferred to the ConDrv device handles using NtReadFile and NtWriteFile, however, these same data buffers are also sent using NtDeviceIoControlFile when Conhost is sending or requesting new data. Therefore, filtering on the FastIoDeviceControl routine should give up the I/O data we are looking for (Figure 3).
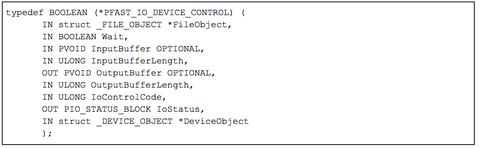
Figure 3: Function prototype for the FastIoDeviceControl dispatch function
Analysis of this function reveals a switch statement for handling passed in IOCTL codes containing the bulk of the functionality exposed to user mode. Figure 4 shows the code that handles the IOCTL codes related to reading and writing data to the console.
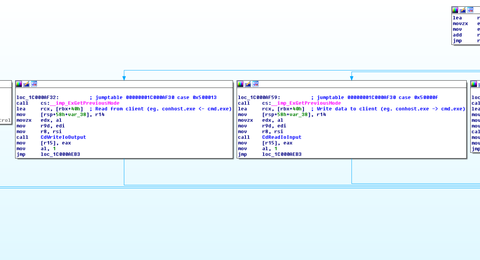
Figure 4: IOCTL handler code in ConDrv
There are quite a few IOCTL codes supported by ConDrv, but for now we only care about a subset of them, which are listed in Table 1.
| IOCTL Code | Function |
| 0x50000B | Complete pending I/O |
| 0x50000F | Data is available to be read from client (e.g. conhost.exe <- cmd.exe) |
| 0x500013 | Data is available to be written to client (e.g. conhost.exe -> cmd.exe) |
| 0x500037 | Launch a new conhost.exe process |
Table 1: Interesting IOCTL handlers supported by ConDrv
The two IOCTL codes responsible for reading and writing data between clients and servers are most interesting (0x50000F and 0x500013). Setting a breakpoint on condrv!CdpFastIoDeviceControl and entering some text into a command prompt causes the debugger to break in the process context of conhost.exe.
Examining the function arguments using the prototype in Figure 3 shows the input buffer, size, and IOCTL code that Conhost supplied when sending the command string to cmd.exe. These arguments are highlighted in yellow, blue, and green respectively and shown in Figure 5. Note: The input buffer is a user mode address mapped into Conhost.
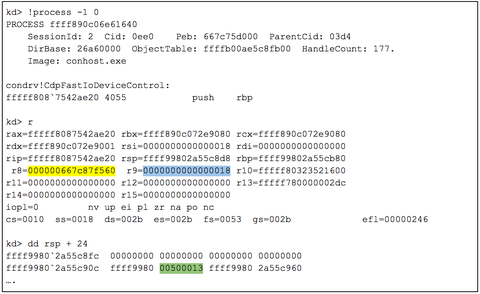
Figure 5: IOCTL Examining the function parameters for condrv!CdpFastIoDeviceControl
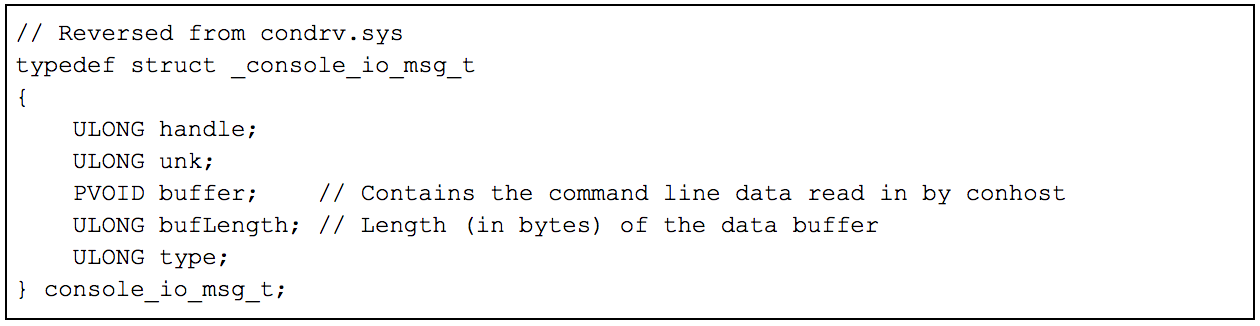
Dereferencing the input buffer shows an opaque data structure. Analyzing more of the ConDrv code that processes the input buffer helps understand the format the data is in. This structure’s format is shown in Figure 6. Note: this is an undocumented structure (from what I can tell) and its fields are based on analysis of the ConDrv code.
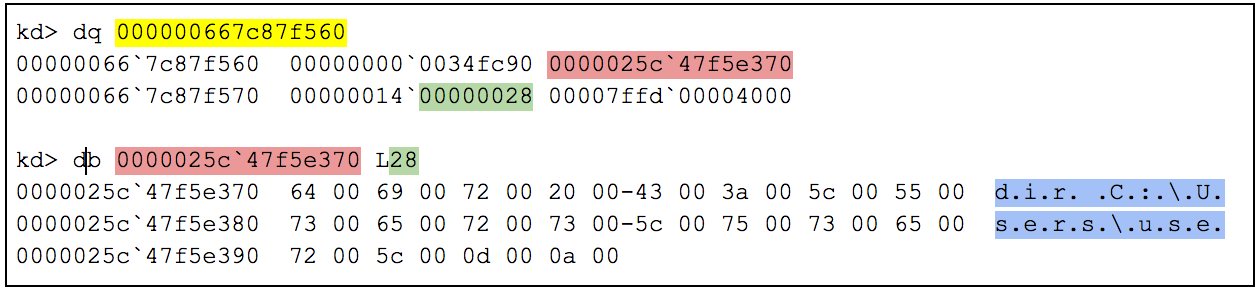
Each I/O message contains a buffer and buffer size of the command data. On output, this same structure is used to deliver the results of the executed command. Figure 7 shows the capture of a console command in Windbg by applying this structure definition to the data. Here we see a simple directory listing command being entered into a command prompt. These same steps can be used to capture the command output as well.
Now that we understand the format of the I/O data and how it is transferred, we can write a proof of concept filter driver to capture it and send it back to user mode for processing. Since we get this data inline, it should be possible to reconstruct all console sessions on the machine. We will attach to \Device\ConDrv and copy the data from the input buffers on every Conhost process on the system. We will then use a Python script to retrieve the captured I/O data that is sent to it from the kernel driver.
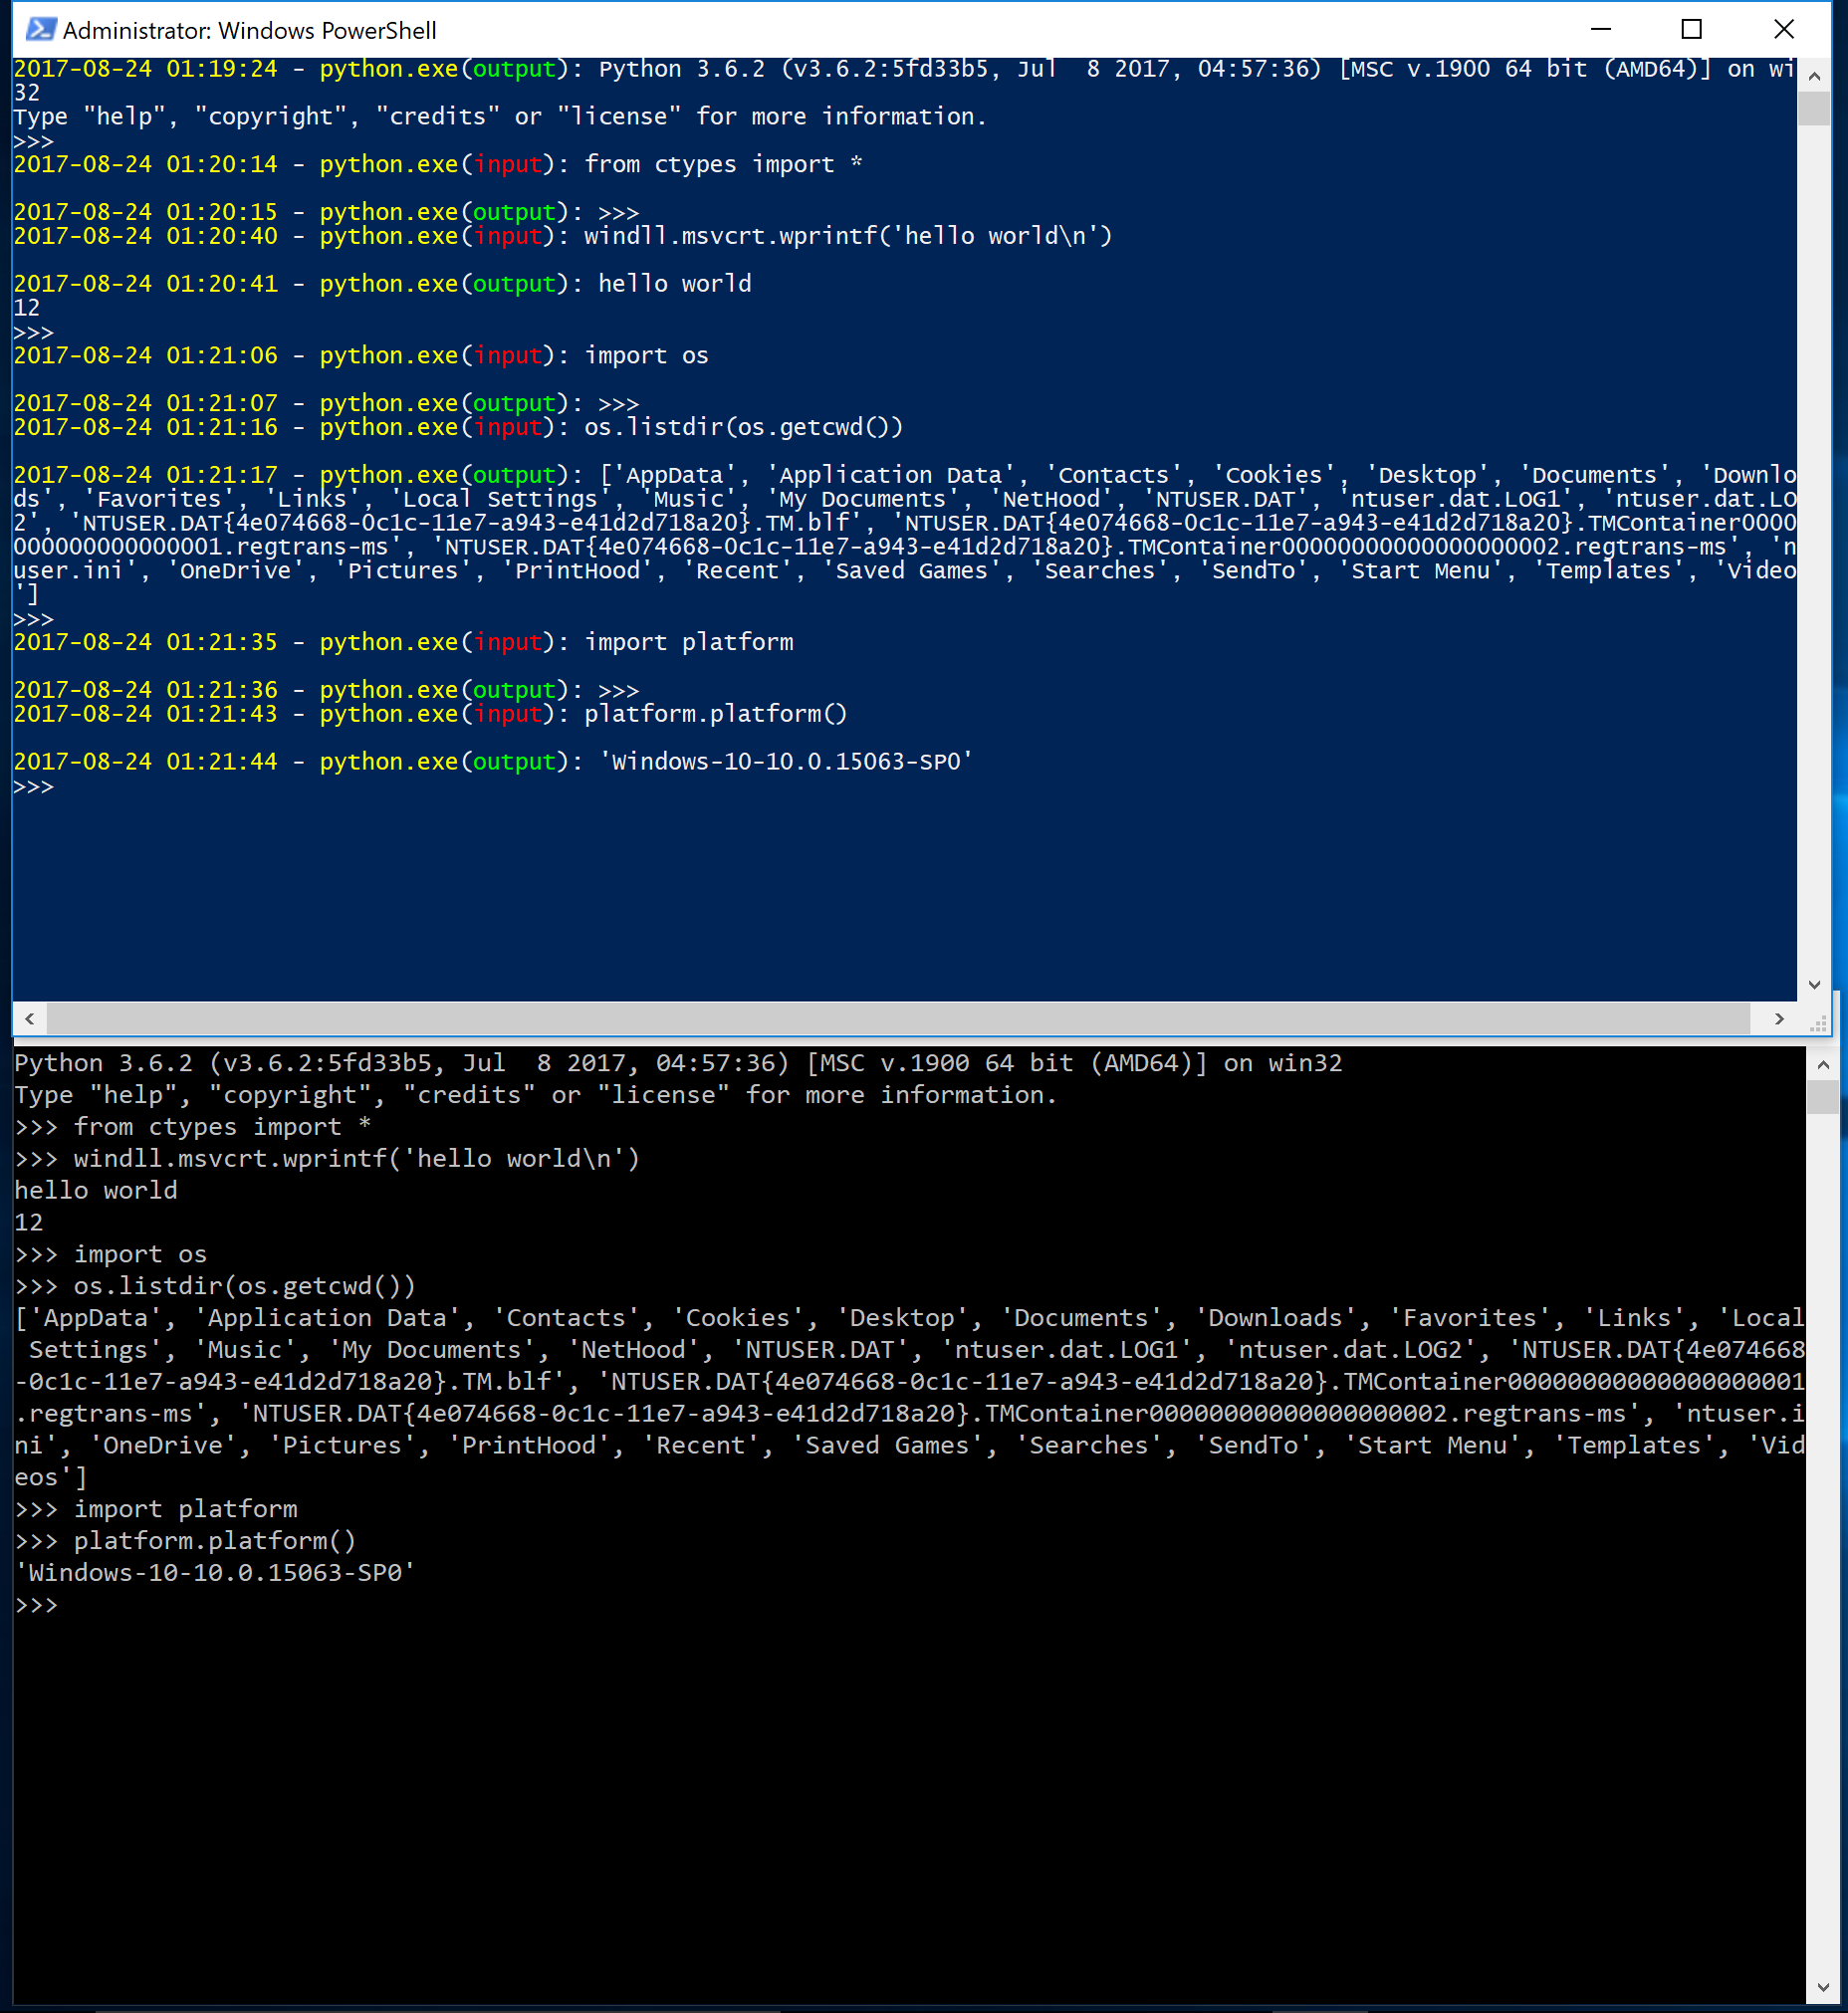
First let's see if we can fully capture the data of a user executing an interactive Python session. Figure 8 shows a user's Python session. The command window on the bottom is a normal user session executing Python code. The window above shows the data that is captured from the ConDrv filter driver. The flow (input vs. output) is identified using the IOCTL codes shown in Table 1. This gives precise context on the commands since the data is sent to the driver inline.
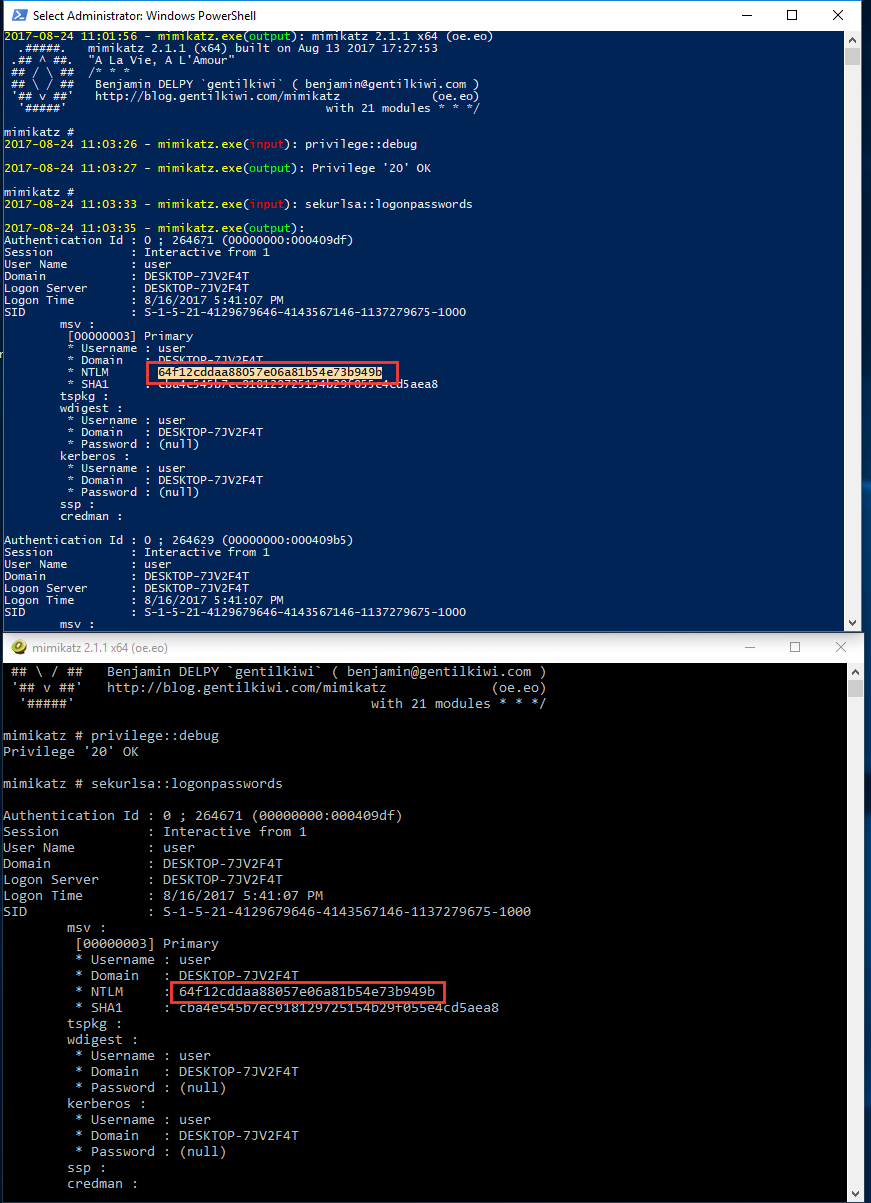
In the beginning of this post, we mentioned mimikatz and how reading its process arguments doesn’t provide the commands if the attacker interacts with the console directly. Figure 1 demonstrates how all that is revealed by the PEB command line arguments is the path of the mimikatz process. Figure 9 demonstrates the captured console I/O from this same mimikatz session. Now we can identify that an attacker was able to acquire NT LAN Manager (NTLM) hashes from the system. We can even tell exactly when they were stolen and what accounts were compromised. Having a timeline of activity like this is crucial during the incident response process, and acquiring this data through other means (such as process memory dumps) lacks valuable context.
Conclusion
Putting this all together, we can now intercept, modify, or outright deny all console input and output on a Windows 8 and later system. This can be used to capture not only I/O from system utilities, but from any program that uses a console. This can range from interactive interpreters such as Python, Ruby, and Perl to security tools such as mimikatz and Metasploit. As attackers continue to act more brazenly on the systems they compromise, being able to identify this activity remains crucial.
Prepare for 2024's cybersecurity landscape.
Get the Google Cloud Cybersecurity Forecast 2024 report to explore the latest trends on the horizon.