


FLARE Script Series: flare-dbg Plug-ins
Introduction
This post continues the FireEye Labs Advanced Reverse Engineering (FLARE) script series. In this post, we continue to discuss the flare-dbg project. If you haven’t read my first post on using flare-dbg to automate string decoding, be sure to check it out!
We created the flare-dbg Python project to support the creation of plug-ins for WinDbg. When we harness the power of WinDbg during malware analysis, we gain insight into runtime behavior of executables. flare-dbg makes this process particularly easy. This blog post discusses WinDbg plug-ins that were inspired by features from other debuggers and analysis tools. The plug-ins focus on collecting runtime information and interacting with malware during execution. Today, we are introducing three flare-dbg plug-ins, which are summarized in Table 1.
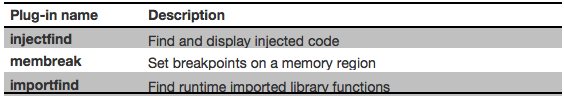
To demonstrate the functionality of these plug-ins, this post uses a banking trojan (MD5: 03BA3D3CEAE5F11817974C7E4BE05BDE) known as TINBA to FireEye.
injectfind
Background
A common technique used by malware is code injection. When malware allocates a memory region to inject code, the created region contains certain characteristics we use to identify them in a process’s memory space. The injectfind plug-in finds and displays information about injected regions of memory from within WinDbg.
The injectfind plug-in is loosely based off the Volatility malfind plug-in. Given a memory dump, the Volatility variant searches memory for injected code and shows an analyst injected code found within processes. Instead of requiring a memory dump, the injectfind WinDbg plug-in runs in a debugger. Similar to malfind, the injectfind plug-in identifies memory regions that may have had code injected and prints a hex dump and a disassembly listing of each identified memory region. A quick glance at the output helps us identify injected code or hooked functions. The following section shows an example of an analyst identifying injected code with injectfind.
Example
After running the TINBA malware in an analysis environment, we observe that the initial loader process exits immediately, and the explorer.exe process begins making network requests to seemingly random domains. After attaching to the explorer.exe process with Windbg and running the injectfind plug-in, we see the output shown in Figure 1.
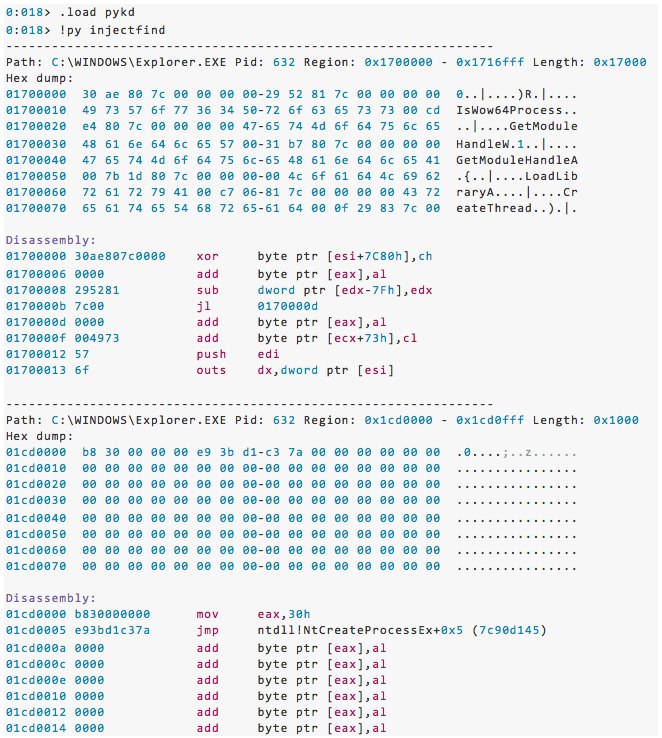
The first memory region at virtual address 0x1700000 appears to contain references to Windows library functions and is 0x17000 bytes in size. It is likely that this memory region contains the primary payload of the TINBA malware.
The second memory region at virtual address 0x1CD0000 contains a single page, 0x1000 bytes in length, and appears to have two lines of meaningful disassembly. The disassembly shows the eax register being set to 0x30 and a jump five bytes into the NtCreateProcessEx function. Figure 2 shows the disassembly of the first few instructions of the NtCreateProcessEx function.
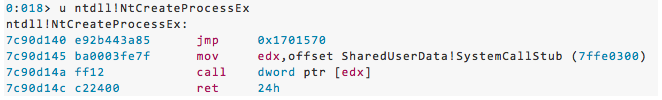
The first instruction for NtCreateProcessEx is a jmp to an address outside of ntdll's memory. The destination address is within the first memory region that injectfind identified as injected code. We can quickly conclude that the malware creates a function hook for process creation all from within a Windbg debugger session.
membreak
Background
One feature missing from Windbg that is present in OllyDbg and x64dbg is the ability to set a breakpoint on an entire memory region. This type of breakpoint is known as a memory breakpoint. Memory breakpoints are used to pause a process when a specified region of memory is executed.
Memory breakpoints are useful when you want to break on code execution without specifying a single address. For example, many packers unpack their code into a new memory region and begin executing somewhere in this new memory. Setting a memory breakpoint on the new memory region would pause the debugger at the first execution anywhere within the new memory region. This obviates the need to tediously reverse engineer the unpacking stub to identify the original entry point.
One way to implement memory breakpoints is by changing the memory protection for a memory region by adding the PAGE_GUARD memory protection flag. When this memory region is executed, a STATUS_GUARD_PAGE_VIOLATION exception occurs. The debugger handles the exception and returns control to the user. The flare-dbg plug-in membreak uses this technique to implement memory breakpoints.
Example
After locating the injected code using the injectfind plug-in, we set a memory breakpoint to pause execution within the injected code memory region. The membreak plug-in accepts one or multiple addresses as parameters. The plug-in takes each address, finds the base address for the corresponding memory region, and changes the entire region’s permissions. As shown in Figure 3, when the membreak plug-in is run with the base address of the injected code as the parameter, the debugger immediately begins running until one of these memory regions is executed.
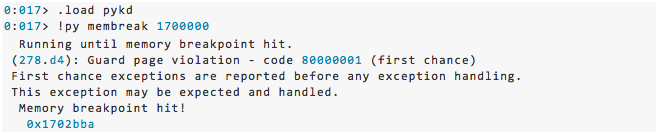
The output for the memory breakpoint hit shows a Guard page violation and a message about first chance exceptions. As explained above, this should be expected. Once the breakpoint is hit, the membreak plug-in restores the original page permissions and returns control to the analyst.
importfind
Background
Malware often loads Windows library functions at runtime and stores the resolved addresses as global variables. Sometimes it is trivial to resolve these statically in IDA Pro, but other times this can be a tedious process. To speed up the labeling of these runtime imported functions, we created a plug-in named importfind to find these function addresses. Behind the scenes, the plug-in parses each library's export table and finds all exported function addresses. The plug-in then searches the malware’s memory and identifies references to the library function addresses. Finally, it generates an IDAPython script that can be used to annotate an IDB workspace with the resolved library function names.
Example
Going back to TINBA, we saw text referencing Windows library functions in the output from injectfind above. The screenshot of IDA Pro in Figure 2 shows this same region of data. Note that following each ASCII string containing an API name, there is a number that looks like a pointer. Unfortunately, IDA Pro does not have the same insight as the debugger, so these addresses are not resolved to API functions and named.
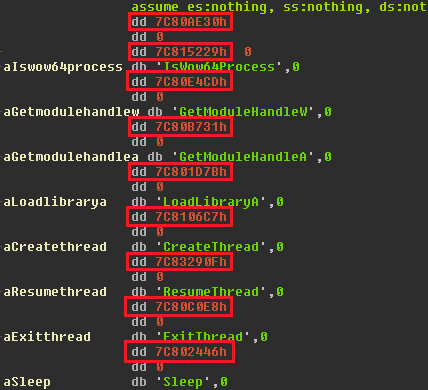
We use the importfind plug-in to find the function names associated with these addresses, as shown in Figure 5.

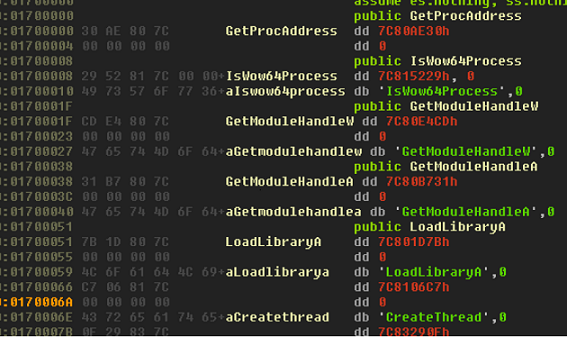
The importfind plug-in generates an IDA Python script file that is used to rename these global variables in our IDB as shown in Figure 2. Figure 6 shows a screenshot from IDA Pro after the script has renamed the global variables to more meaningful names.
Conclusion
This blog post shows the power of using the flare-dbg plug-ins with a debugger to gain insight into how the malware operates at runtime. We saw how to identify injected code using the injectfind plug-in and create memory breakpoints using membreak. We also demonstrated the usefulness of the importfind plug-in for identifying and renaming runtime imported functions.
To find out how to setup and get started with flare-dbg, head over the github project page where you’ll learn about setup and usage.
Prepare for 2024's cybersecurity landscape.
Get the Google Cloud Cybersecurity Forecast 2024 report to explore the latest trends on the horizon.