


Analysis of Time-to-Exploit Trends: 2021-2022
Executive Summary
- Mandiant Intelligence analyzed 246 vulnerabilities that were exploited between 2021 and 2022.
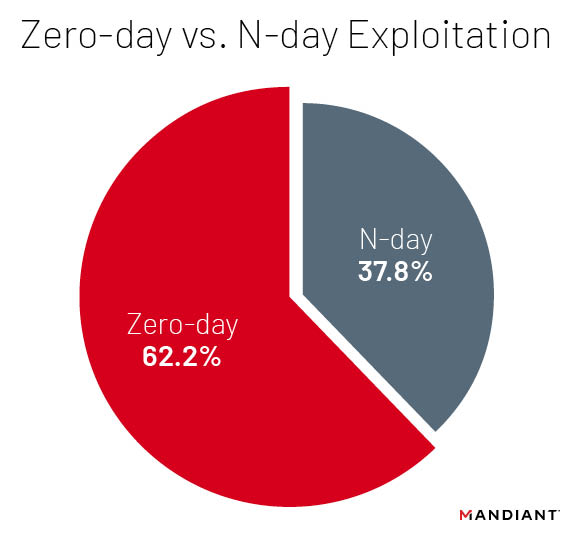
- Sixty-two percent (153) of the vulnerabilities were first exploited as zero-day vulnerabilities.
- The number of exploited vulnerabilities each year continues to increase, while the overall times-to-exploit (TTEs) we are seeing are decreasing.
- Exploitation of a vulnerability is most likely to occur before the end of the first month following the release of a patch.
- Microsoft, Google, and Apple continue to be the most exploited vendors year-over-year, but the last two years were the first time the top three vendors accounted for less than 50 percent of the overall vulnerabilities exploited.
Threat Detail
As the number of discovered and disclosed vulnerabilities continues to rise year after year, organizations increasingly struggle to determine effective patch prioritization strategies that truly lower their risk of exploitation. While predicting which vulnerabilities will be exploited remains challenging, understanding trends in historical exploitation timelines can help organizations better prioritize remediations and even help determine patching timeframes for specific vendors or products. While doing so cannot prevent impacts in all cases, understanding common targets and when they are likely to be exploited will increase the likelihood of limiting or preventing damage from exploitation to vulnerable systems.
Mandiant analyzed 246 vulnerabilities that were disclosed in 2021 and 2022 that we tracked as exploited in the wild. The majority of these vulnerabilities, 153, were exploited as zero-days (vulnerabilities disclosed before patches are made available), compared to 93 vulnerabilities first exploited as n-days (vulnerabilities first exploited after patch) (Figure 1). Zero-days have historically, and continue to, outpace n-day vulnerabilities, although we note that some zero-days continue to be exploited even after patches are released.
While our data is based on reliable observations, we judge the numbers are conservative estimates, as we relied on the first reported exploitation of a vulnerability linked to a specific date. Frequently, first exploitation dates are not publicly disclosed or are given vague timeframes (e.g. “mid-July” or “Q2 2021”), in which case we often assume the latest date meeting that definition for the purpose of this analysis. It is also likely that in some cases, undiscovered exploitation occurred before researchers recorded exploitation attached to a certain date. Therefore, the actual time to exploit is almost certainly earlier than this data suggests.
Patch-to-Exploitation Timelines
As we continue to see an increase over time in the number of vulnerabilities exploited, both as n-days or zero-days, we are simultaneously observing a decrease in the average time taken to exploit them either prior to or after public disclosure, referred to hereinafter as time-to-exploit (TTE). We observed an average TTE of 63 days throughout 2018 to 2019, which we then saw decrease to 44 days in 2020 and early 2021. For 2021 and 2022, we saw a continued, notable decrease in TTE to 32 days, about 75% of the previous two years. Given that the proportion of n-days to zero-days was practically identical (38:62 as opposed to 39:61), the time between disclosure and exploitation is consistently trending downward. However, across 2020 and into the first quarter of 2021, we observed that 41 percent of n-day vulnerabilities were exploited within weeks of disclosure. Across 2021 and 2022, we observed 44 percent of n-day vulnerabilities exploited within two months. This suggests that n-day exploitation timelines may have grown slightly, but the high proportion of zero-days seen across the last two years, especially in 2021, skewed the total TTE average. This TTE average also accounts for seven unpatched vulnerabilities, for which we capped TTE timelines at the end of their respective years. If we had not capped the TTE timelines for those seven unpatched vulnerabilities, the average TTE would drop from 32 to 20 days.
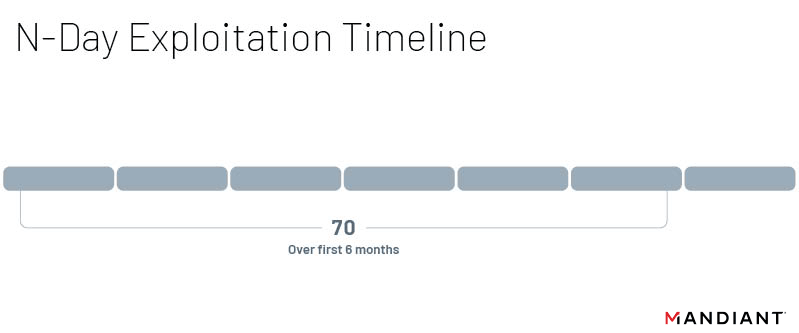
Following public disclosure of a vulnerability, we found that exploitation was most likely to occur within the first month following the initial patch. Thirteen vulnerabilities were exploited within a week of disclosure, and another seven were exploited within a second week. In total, we found that 29 n-day vulnerabilities were exploited within the first month of being disclosed. Significantly fewer vulnerabilities, 23, were first exploited after the initial six months. While the likelihood of vulnerabilities being exploited significantly decreases after the first several months following an available patch, these trends do not rule out exploitation of known vulnerabilities long after they’ve been discovered and disclosed. There were still six n-days exploited over a year after their patch, including some that were not exploited until almost two years later. This is not a new trend however, and similar vulnerabilities exploited years after their initial patch have been observed in previous years. A key takeaway from this is that while threat actors generally prefer newer vulnerabilities, they will not completely shy away from vulnerabilities due to age and public knowledge; threat actors still value using already known and documented vulnerabilities as opposed to discovering new ones. While it may be tempting to ignore patches that haven’t been implemented within their first year, there are actors ready to target unpatched systems.
Of the 153 zero-days identified in 2021 and 2022, only 35 (23 percent) of them received patches after the first month following first known exploitation, indicating that most zero-days are remediated in a timely manner. In fact, 101 zero-days were patched within the first week of exploitation being first known. This reinforces the need for organizations to utilize multiple strategies when trying to protect against zero-day exploitation, as a well-rounded, defense-in-depth strategy is often needed when remediations do not yet exist.
It is also important to acknowledge that a vulnerability’s first exploitation is not necessarily its last. As long as a vulnerability can be exploited, there is no reason for an actor to stop functional and successful exploitation. Mandiant has identified many vulnerabilities that are still not only used long after initial exploitation, but also after patches were made available. This demonstrates the importance of patching vulnerable systems, even when well after the initial patch was released.
Exploit/PoC-to-Exploitation
The percentage of exploited vulnerabilities to receive some form of public exploit or proof-of-concept (PoC) code has remained surprisingly steady for many years. For the vulnerabilities first disclosed in 2021 and 2022, 125 (51 percent) of them eventually had publicly available code. Of these, 67 (54 percent) had code available either the same day of first known exploitation or before exploitation was identified. These numbers are directly in line with previous observations dating back to 2015, with around 50 percent of all exploited vulnerabilities since that time receiving some form of code.
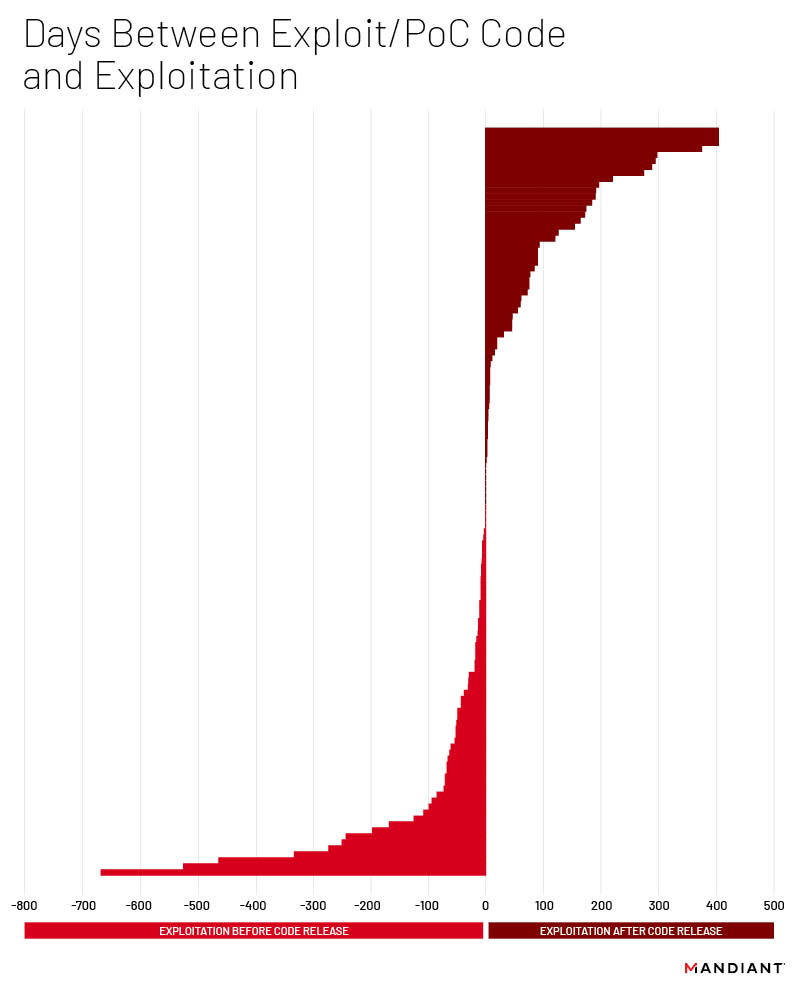
Fifty-three (22 percent) of total vulnerabilities were first exploited after exploit or PoC code was released. While this would initially seem to suggest that the existence of PoC or exploit code has no strong influence on exploitation, when comparing vulnerabilities that do and do not have exploit code, there is an interesting trend. Of the vulnerabilities to receive exploit code, 51 (41 percent) were first exploited as zero-days, whereas 102 (84 percent) were first exploited as zero-days for those without available code. On the surface, this is not surprising as most actors exploiting zero-day vulnerabilities are likely more sophisticated, and therefore do not rely on the availability of code to perform activities. This does, however, suggest that the availability of code does increase the likelihood of a vulnerability being exploited after patch, albeit minimally.
Exploited Vulnerabilities by Vendor
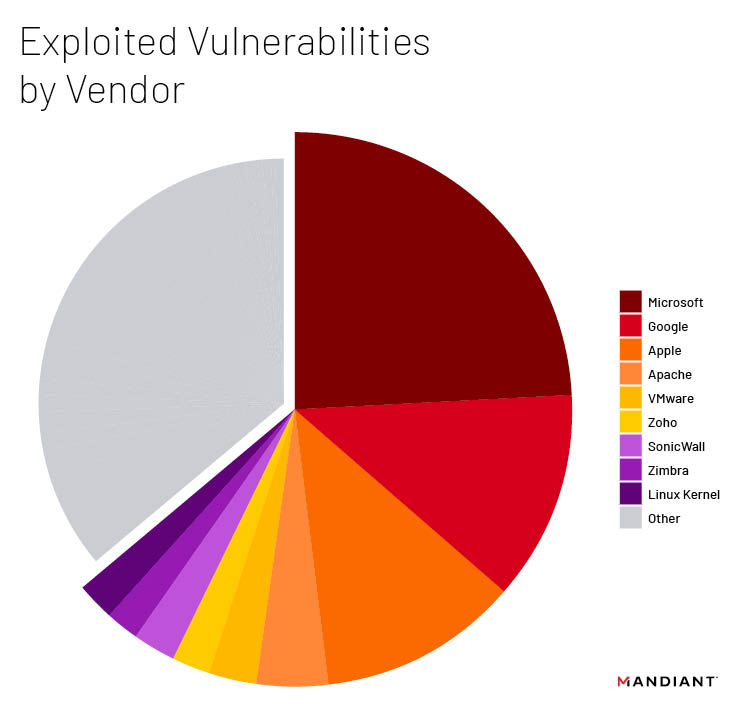
Vulnerabilities exploited between 2021 and 2022 affected a total of 60 unique vendors. The most commonly exploited vendor, with 60 vulnerabilities exploited over the last two years, was Microsoft. Microsoft has consistently been the most widely exploited vendor, followed by Google and Apple, almost certainly due to the popularity and ubiquity of their products enabling actors the widest possible attack surface. Google followed with the second most exploited vulnerabilities, totaling 30, almost half of Microsoft’s count. The final major vendor targeted for exploitation in this time period was Apple with 29. All other vendors had fewer than 10 vulnerabilities each, with most having five or less. These top three targeted vendors have been consistent for several years, with Microsoft consistently in the lead, and Google and Apple vying for the second and third spots, flip flopping positions across years. It is important to note, however, that the total number of vulnerabilities affecting a vendor does not directly relate to how secure or insecure a vendor’s security posture is, nor does it signify that it is "less secure" than its competitors.
While there has been little variation in the top targeted vendors for many years, one trend of note for targeted vendors is that the top targeted vendors have slowly accounted for a smaller overall percentage of vulnerabilities targeted over the years, suggesting that actors are increasingly targeting a more diverse set of vendors and products. This two year period is the first time since we started tracking targeted vendors that the top three targeted vendors accounted for less than 50 percent of the targeted vulnerabilities. The resulting takeaway here is that while organizations should still prioritize timely remediations for highly targeted vendors such as Microsoft, Google, and Apple, they are increasingly forced to remain vigilant and flexible when prioritizing patches for other remediations from other exploited vendors as well. Focusing solely on the top three vendors no longer provides a sufficiently safe approach to vulnerability management.
Implications
As long as patch cycles remain lengthy for vulnerabilities that provide access to either code execution or privilege escalation, threat actors will continue to identify and exploit these vulnerabilities. The time and effort required to discover and develop exploits for zero-day vulnerabilities is significantly more work than developing a working exploit for known vulnerabilities, especially when proof-of-concepts and in-depth technical details already exist publicly. Threat actors continue to expect that vulnerabilities with released patches may not be patched immediately, or potentially ever in certain circumstances. Actors increasingly target a wider variety of software, including those less regularly prioritized for speedy remediation. As a result, there is a potentially higher likelihood that attackers are able to find success in targeting less ubiquitous software than they would if they were to target more common products, such as Microsoft operating systems or various browsers.
While it is important to prioritize the most commonly targeted vendors, the increased volume of other targeted vendors may make it more difficult to effectively prioritize patching. As a result, the ability to adapt and address a wider variety of vendors during patching cycles will be more important than ever before. Between 2021 and 2022, approximately 25–30 percent of zero-day vulnerabilities affected vendors beyond Microsoft, Google, and Apple. While patching may be prioritized given those three companies’ ubiquitous appearances in exploited vulnerability statistics, other vendors and products still compose significant portions of attack surfaces. Security teams must weigh the risks across their entire attack surface when determining how to most efficiently protect their systems and networks, utilizing defense-in-depth techniques for the most effective coverage and prevention.
While the existence of available exploit code does appear to directly impact the likelihood a vulnerability is exploited, the existence of exploit code is not deterministic as to whether a vulnerability will be exploited. As a result, it should not be considered a primary prioritization metric. Active exploitation, especially if known to target your specific organization, remains the highest priority when determining what vulnerabilities to prioritize remediation for. Exploit code can be an indicator of potential threat activity in the future, but there has to be actor interest in targeting the vulnerability as well for it to become an active threat. There are many vulnerabilities that have received exploit code that have never been exploited, and focusing solely on the existence of exploit code could result in inefficient patch prioritization.
Outlook
Mandiant Intelligence expects that vulnerabilities will continue to be targeted and exploited despite patch availability. We expect zero-day vulnerabilities will continue rising on average, and similarly expect overall exploitation to rise in general over the coming years. A continued increase in zero-day use will maintain the downward swing of average TTE; however, the next few years may reflect a similar TTE to the last two years as opposed to decreasing it much more, if at all. This is due to the fact that while zero-day usage sways TTE lower, we don’t expect n-day exploitation to stop. Our numbers will be impacted by both zero-day exploitation as well as delayed n-day exploitation, which both share great influence over the resulting average TTE.
Based on recent trends, we expect either the number of targeted vendors and/or the percentage of vulnerabilities not affecting the top three vendors will continue to increase over the coming years. We have already seen these numbers increasing over the last several years. Barring a significant change in the exploitation landscape, such as a new product that is as ubiquitous and easy to target as previously widely targeted and end-of-life products Java or Flash Player, then we have no reason to think the current trend will change. At worst, these numbers would start to plateau, but there is no indication at this time to suggest any notable decrease.
Prepare for 2024's cybersecurity landscape.
Get the Google Cloud Cybersecurity Forecast 2024 report to explore the latest trends on the horizon.